View test suite analytics in Katalon Studio
This document describes the Analytics components in Katalon Studio.
Important:
After executing a test suite, you can find the execution data in two places:- Katalon Studio version 8.6.5 onwards.
- You have enabled uploading reports to Katalon Platform. For instruction, see Integrate Katalon TestOps and Katalon TestCloud with Katalon Studio.
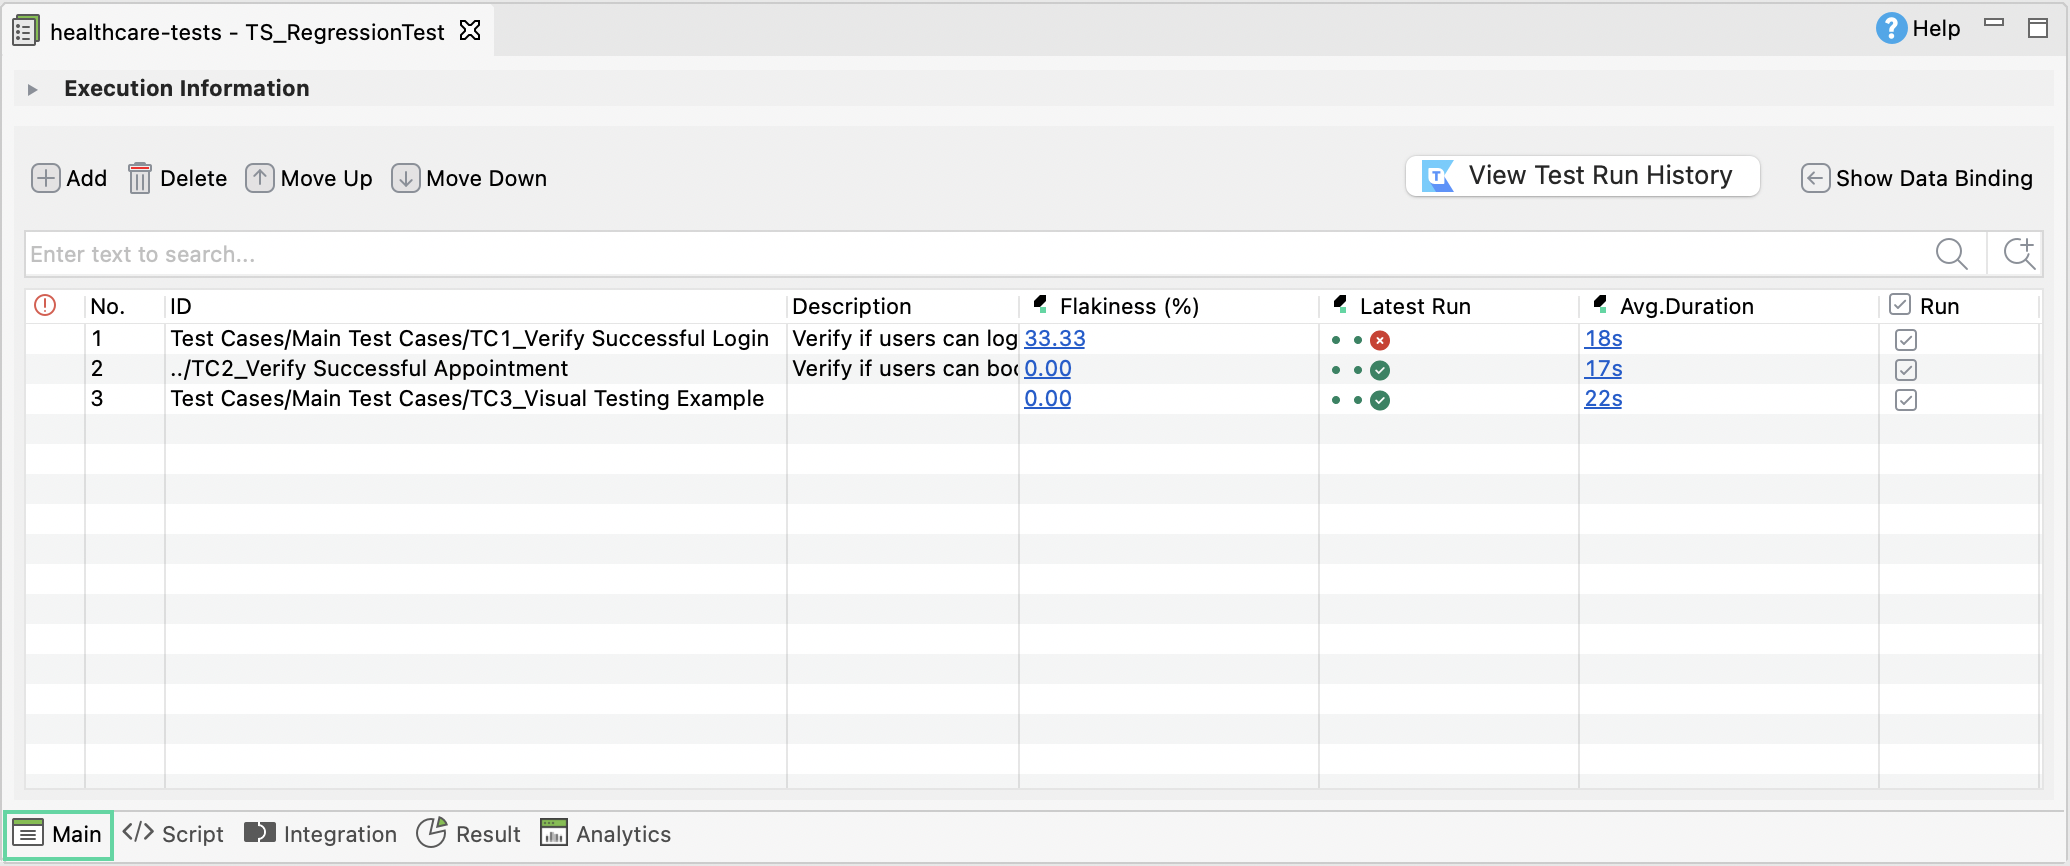
In Main tab

In the Main tab, you can find three analytics columns: Flakiness (%), Latest Run, and Avg. Duration (Average Duration). These columns provide insights into the trends and performance of each test case.
| Column | Description |
|---|---|
| Flakiness (%) | The percentage calculated from the number of failed/passed statuses of the test case |
| Latest Run | The execution statuses of three latest test runs |
| Avg. Duration | The average time (in seconds) taken for the test case to complete its execution |
In Analytics tab
Note:
- Only applicable for test suite.
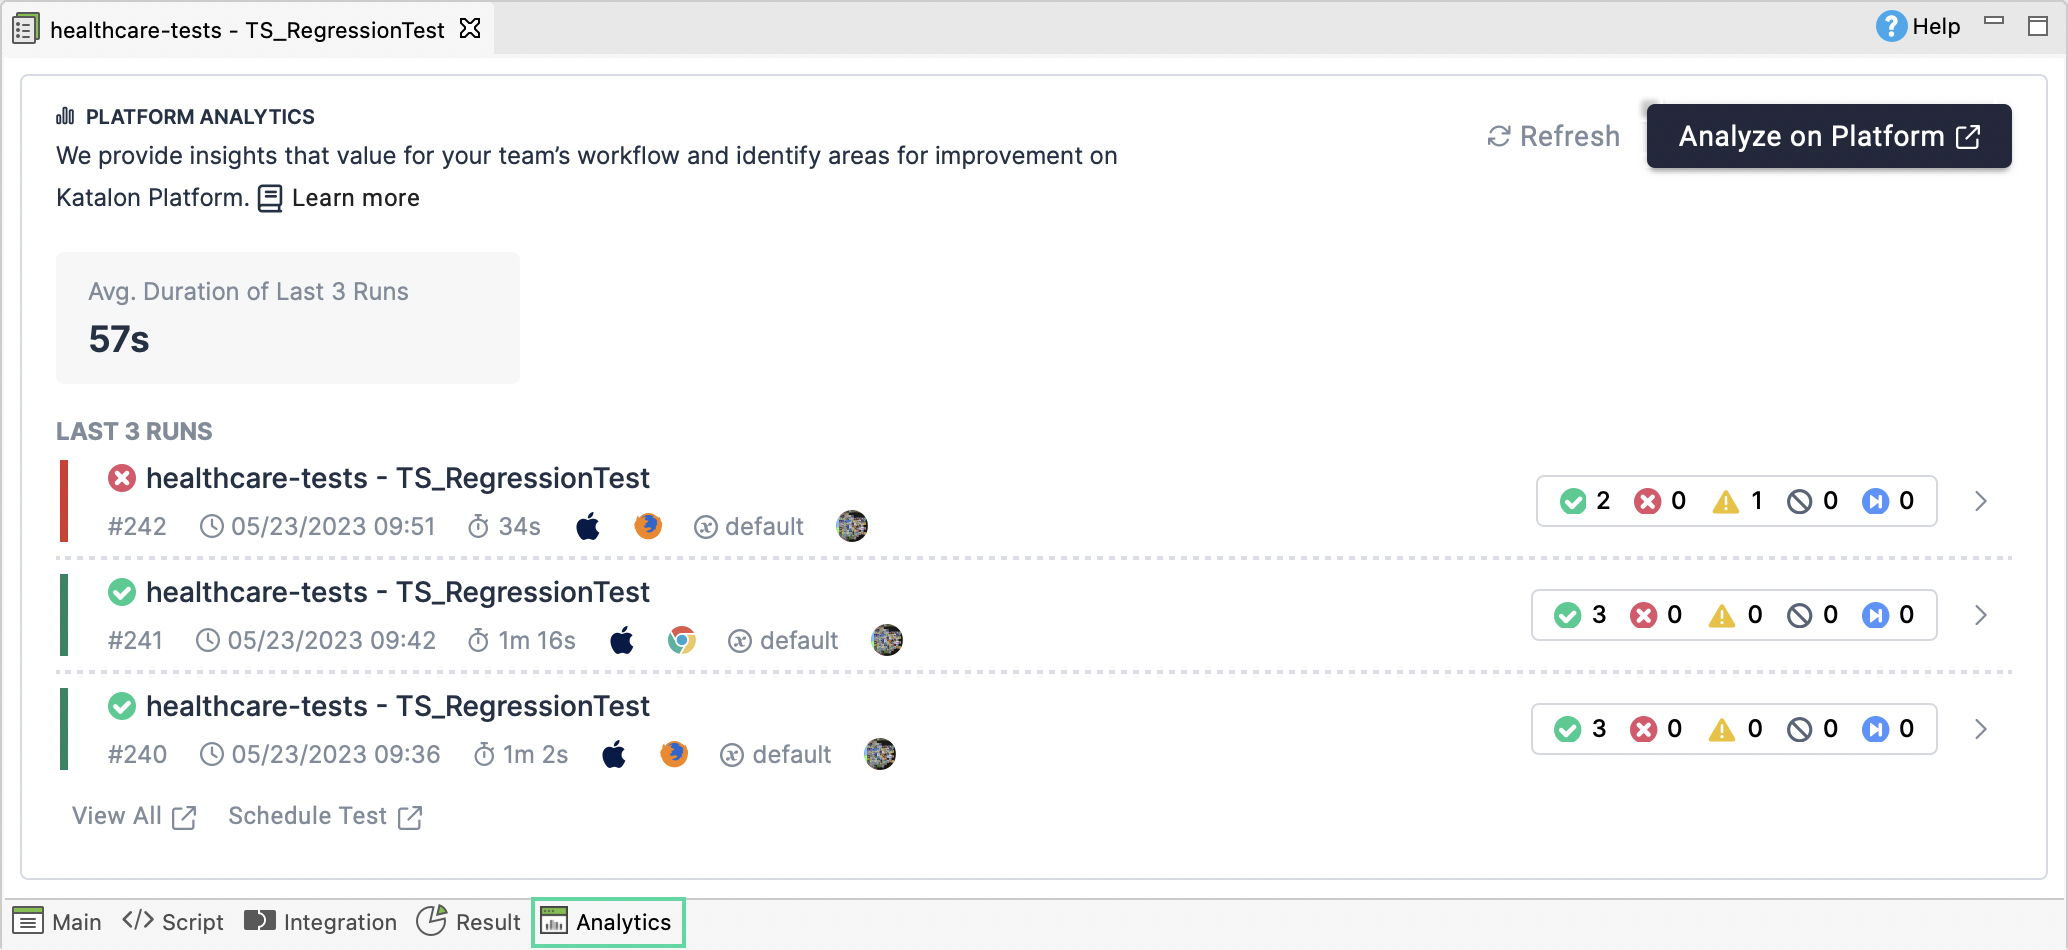
The Analytics tab provides you with insights fetched from Katalon Platform, where you can gain insights into the overall performance of the test suite.

| Component | Description |
|---|---|
| Avg. Duration of Last 3 Runs | Displays the average time it takes to complete the test suite execution based on the last 3 runs |
| Last 3 runs | Displays an overview of testing configuration used in the last 3 test suite executions and their statuses: Passed, Failed, Error, Incomplete, and Skipped |
To access more detailed and advanced test reports, you can click on Analyze on Platform to open TestOps dashboard. To learn more about the reports on TestOps dashboard, see TestOps dashboard overview.