Test activities reports
Testing activities help you evaluate and verify if your product is doing what it's supposed to do. If your product works the way it should, testing prevents bugs and reduces development costs while improving the performance of your software/application.
A centralized report on your test activities enables faster troubleshooting and assists you in the decision-making process of your product cycle.
In Katalon TestOps, the Test Activities report compiles test activities over a specified period. You can filter test runs by day, week, and month and check test results within your desired period.

The default period is 7 days (from Monday to Sunday of the most recent week, compared to the current date).
Test activities insights
Total test runs
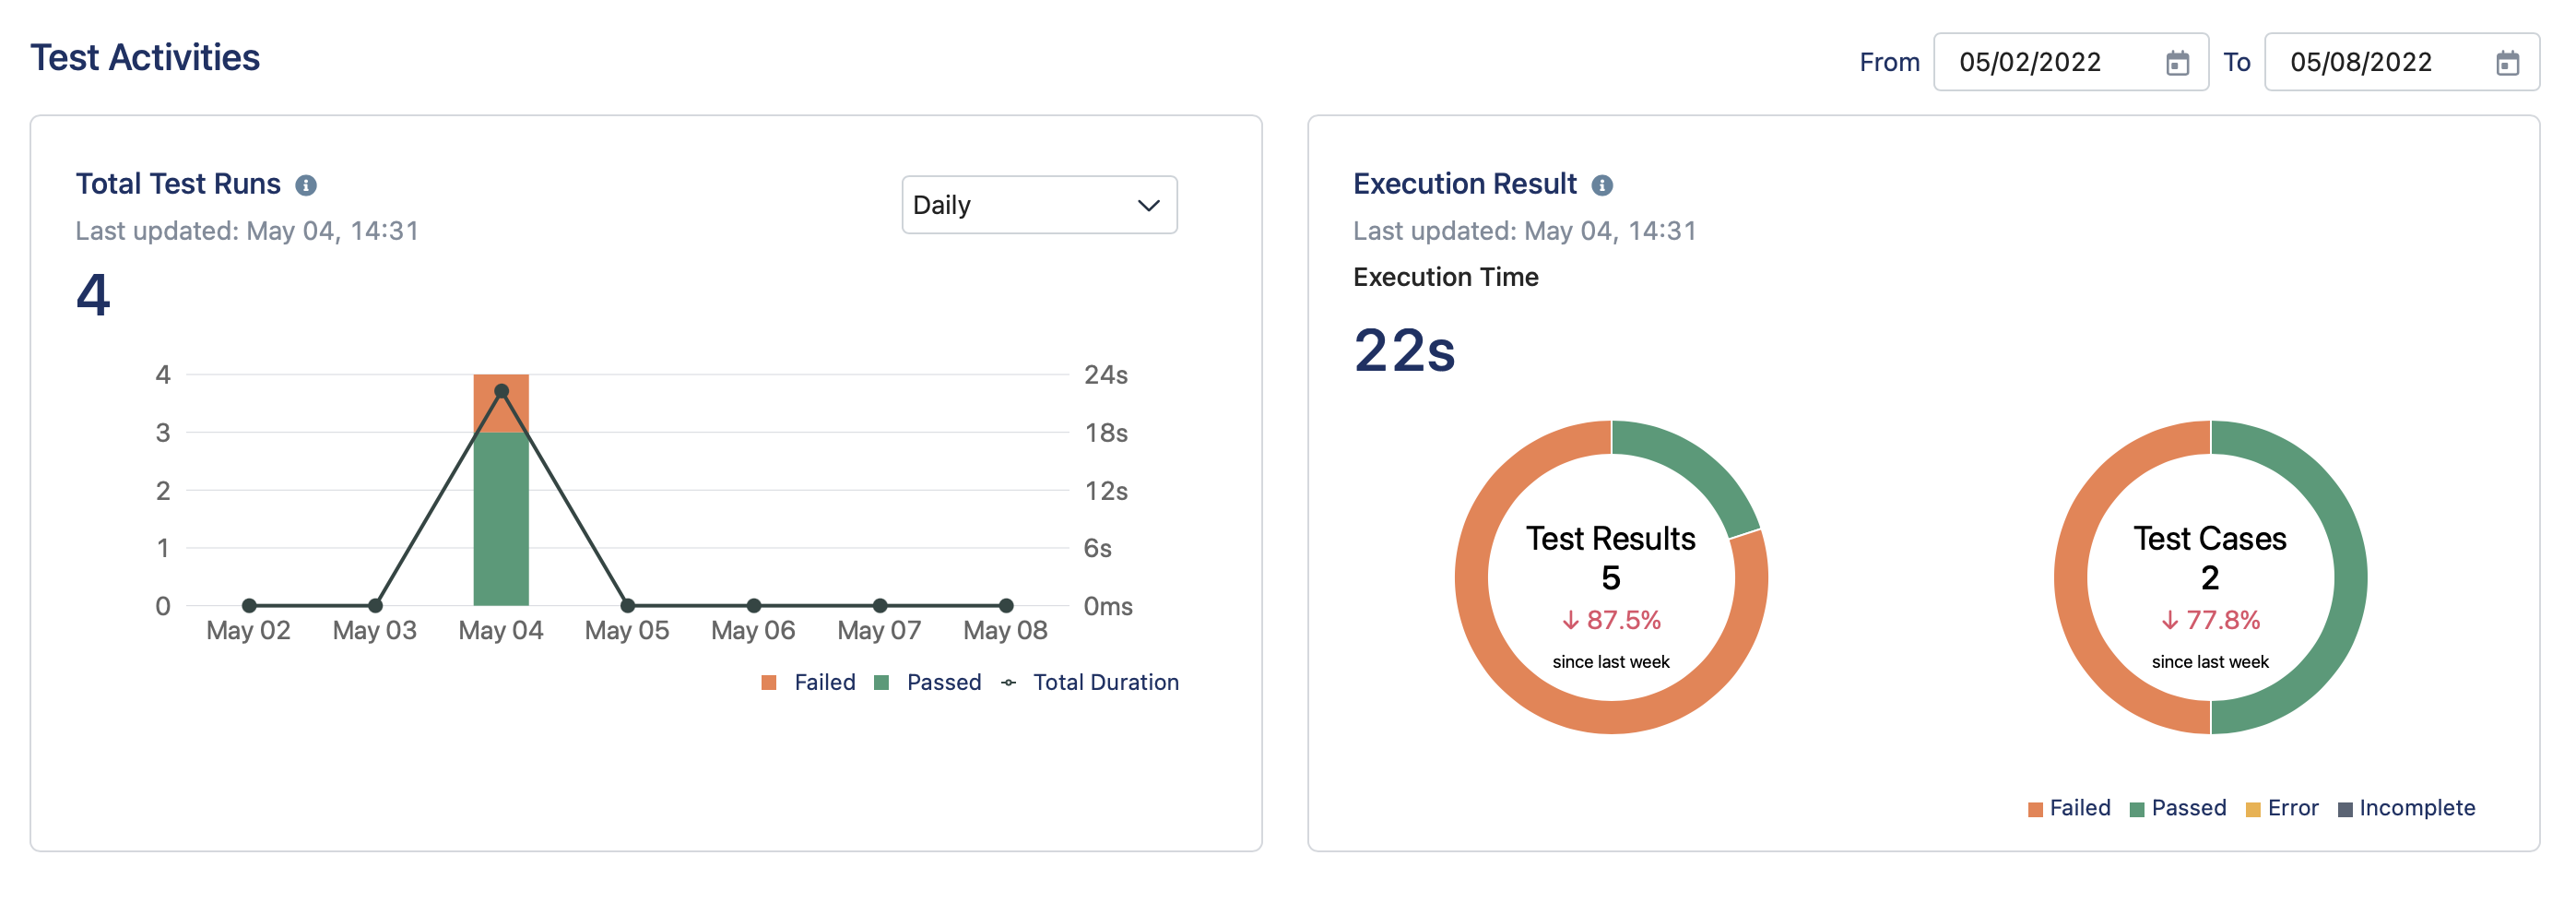
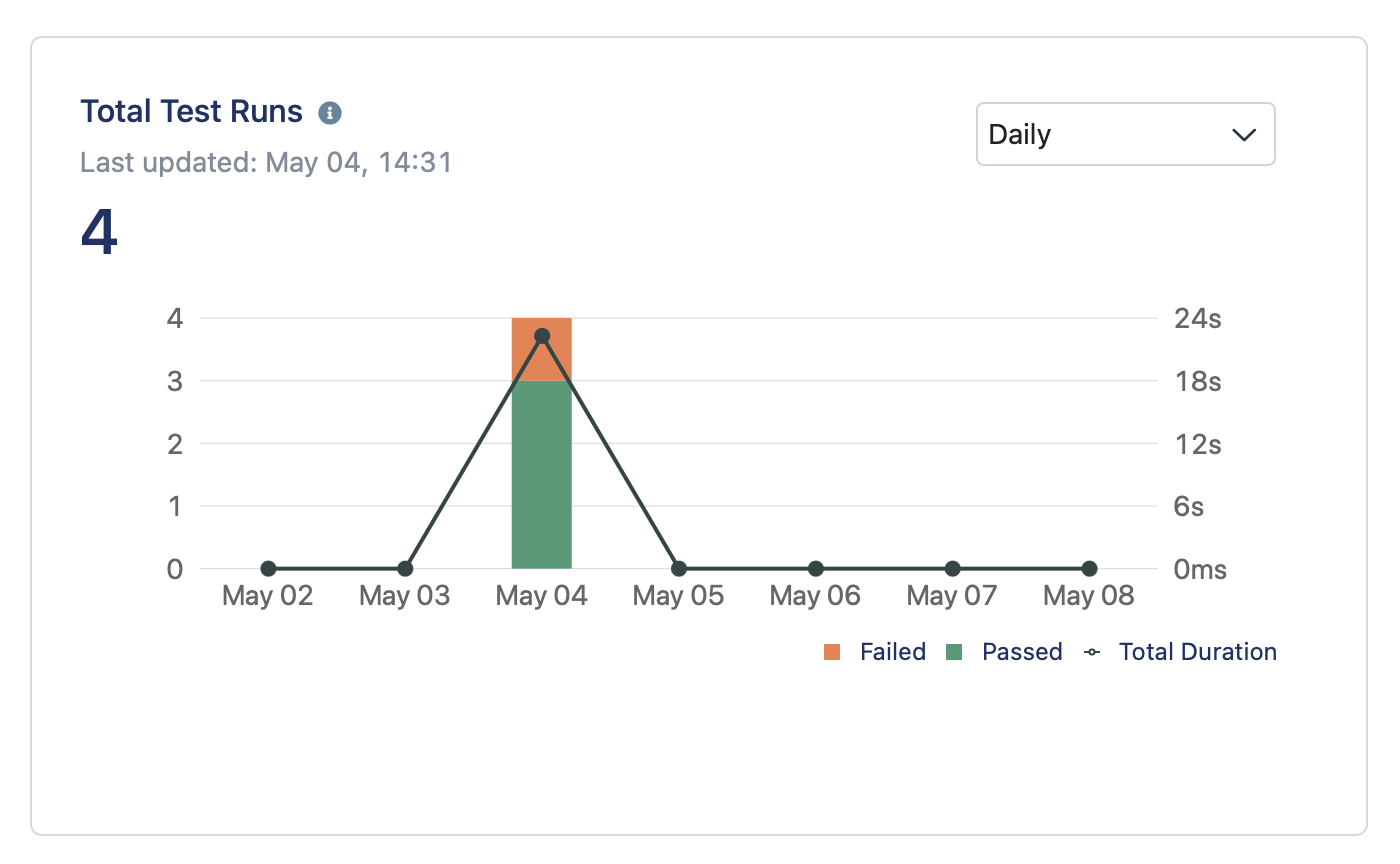
The Total Test Runs chart provides a daily/weekly/monthly testing statistic by highlighting the number of tests with passed and failed status plus the total testing duration.
The chart allows you to answer the following questions:
Are tests frequently run every day/week/month?
What is the status of all test runs each day/week/month (whether more tests have passed or failed)?
How long does it take to run tests each day (by checking the total duration of test runs per day)?
You can also compare the total duration of test runs between each day to see which day tests run slow and which day tests run fast.
For instance, yesterday, the actual time to execute 5 tests was 2 minutes; however, today, it takes 5 minutes to complete 3 test runs. Knowing this prompts you to investigate further to ensure better testing quality and testing timeline.

Execution result
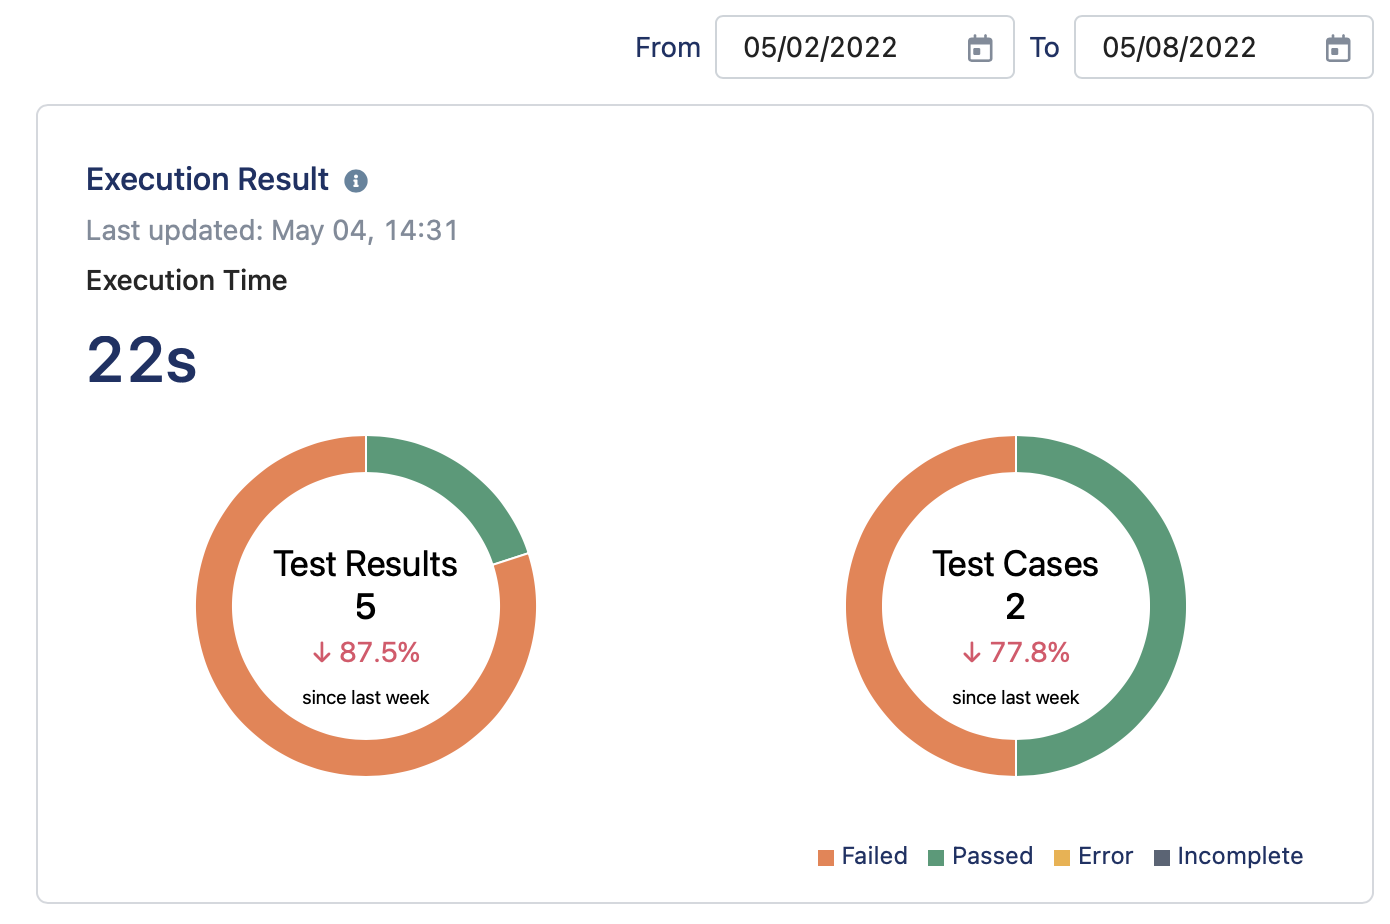
You also see a complete overview of test results in the Execution Result chart, where test cases and results are highlighted with the following 4 options: passed, failed, error, or incomplete, together with their execution time.
This chart allows you to answer the following questions:
What is the quality of the test cases and results within the specified period?
Since it's less worrying if there are fewer failed or error tests, or else you need to take further actions (revise test cases and their results) to ensure your application/software is working as expected.
What is the difference in the quality of tests between last week and this week? Has the number of failed/passed test results decreased or increased within 2 consecutive weeks?
What are the number of test cases and test results this week compared to last week? Is there an increase or decrease in the number of test executions?
Through analyzing the chart, you can evaluate your test activities and take further actions if needed.
